Process Mapping
Process mapping is an important tool in any Operational Excellence initiative (Lean, Six Sigma, Lean Six Sigma, Design for Six Sigma DFSS, Kaizen, Continuous Improvement ). High Level process maps like Macro Maps and SIPOC Diagrams are used to graphically depict a process in its most simplified “big picture” state. A more detailed process map is required to clarify what actually happens in each process.
Mid-level process maps are the mapping tool of choice to clarify the current situation. Mid-level process maps identify waste and defects that can only be uncovered through intensive discussion and documentation by those who execute the process. By documenting steps using specific shapes and directional arrows, mid-level maps let a company visualize and better understand the existing opportunities for improvement. Activities related to waste and defects should not be accepted as “business as usual” and should be prime targets for improvement projects. As the saying goes, “a picture is worth a thousand words,” and the mid-level process maps provide this picture.
Process Flow Diagram
A process flow diagram is a detailed process map that shows every step of a process, including the “hidden factory.” The “hidden factory” is an expression used for any unnecessary steps in the process which, though not documented, are routinely performed. Often, these unnecessary steps are performed in order to rework defective items. The process flow diagram uses standard flowchart symbols and nomenclature to communicate different types of work common to all different types of businesses and organizations. For example, a diamond shaped symbol in a process flow diagram represents a decision point.
A process flow diagram is used for many reasons like to create a detailed visual representation of the process flow, help identify rework loops and potential bottlenecks, identify serial and parallel process steps, identify internal supplier and customer relationships, identify inputs and outputs for each process activity. Process Flow Diagrams are made up of the following elements:
- Shapes that represent certain types of activities
- Connecting arrows that indicate flow of the work unit as it moves through the process
- Value Add and Non-Value Add markers on process steps
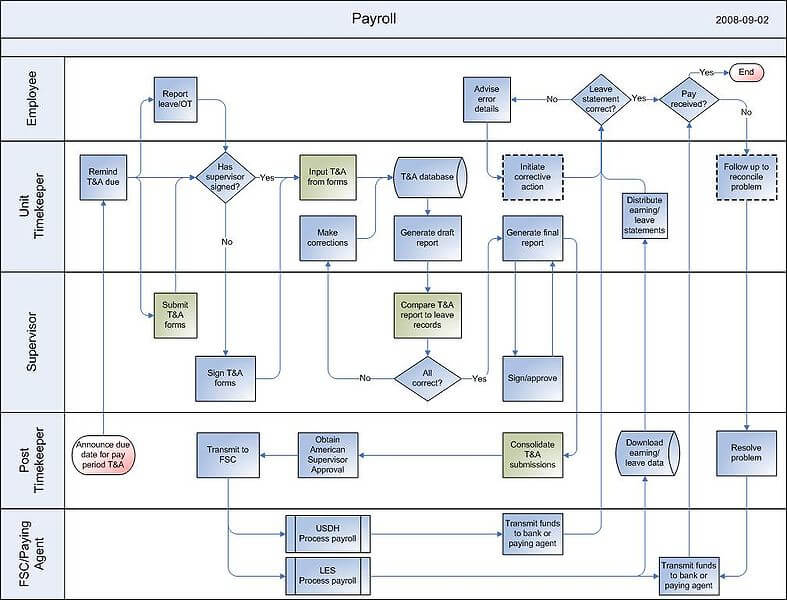
Swimlane Map
Swimlane maps, also known as Functional Process Maps, provide more detailed information focused around who completes each step and when each process step is completed. These maps provide a picture of the handoffs, relationships, and dependencies that occur between different functions and departments. The map gets its name from the horizontal rows used to designate a person, function, or department performing the process steps. The “lanes” created by the rows look like what you’d see in an Olympic swimming pool.
The handoffs are clearly depicted by the flow line crossing from one lane to the other. It is one of the most commonly-used mid-level maps in transactional and service processes and is excellent for illustrating roles and responsibilities such as who does what and in what timeframe and who makes key decisions. Swimlane maps also clearly show process steps that occur in series, or one after another, in addition to tasks performed in parallel.
This helps us map process complexities that wouldn’t be seen in another map. Because of this, swimlane maps generally show process flows that are broken, redundant, confusing and those that simply don’t work. And, swimlane maps can be used to display other pieces of information that are important in analyzing your process, like whenever the database is accessed for information on cycle times, value add or non-value add steps, queues, inventory, or bottlenecks.
The time line is an essential part of the swimlane map. It extends from left to right across the map and should provide a clear understanding of when the process steps occur. Phases are another important component of a swimlane map. Often, a map can become extremely complex. To simplify the map, it’s best to use high-level breakdown into phases or categories with the idea of helping those new to the map to understand it.
Recommendations
Some recommendations while using process maps. First, gather and collect any existing visual representations of your process and bring them to your mapping session. A lot of detail can be missed unless you can recall what actually takes place during each step of the process in question. It is always helpful to get copies of forms, procedures, and job aides. In today’s electronic world, consider printing screenshots so that you have a way to clarify the tasks during the mapping session. Use red and green dots to denote value add and non-value add process steps. This visual exercise identifies the amount of opportunity you have to improve the process.
Consider how to make the value add steps line up and how to arrange them to reflect the process’s sequence without all of the non-value add steps. Some facilitators use bright colored Post-it notes to show where improvement opportunities exist or where more information is available. Any visual cue you can add to the map will enhance its value to your project. Make sure one of your team goals is to attempt to reduce the number of swimlanes in a swimlane map. Every additional lane adds another layer of complexity and another opportunity for error, so your objective should be to remove as many as possible, without violating any requirements for separation of duties. Finally, look for opportunities where your process can run in parallel instead of in series in order to cut time from your process. Idle time is one of the eight types of waste, and process mapping can help you see where those times occur.
Related Page:
Check out our Lean Training, Six Sigma Training, Lean Six Sigma Training, Continuous Improvement Training or the full range of Training Courses for relevant courses on how to streamline & improve your business processes.